Extract
Receive source data through an API, database access, CSV or Excel file, PDF, ERA/EOB, note, or scan.

Result · usable data across disconnected systems
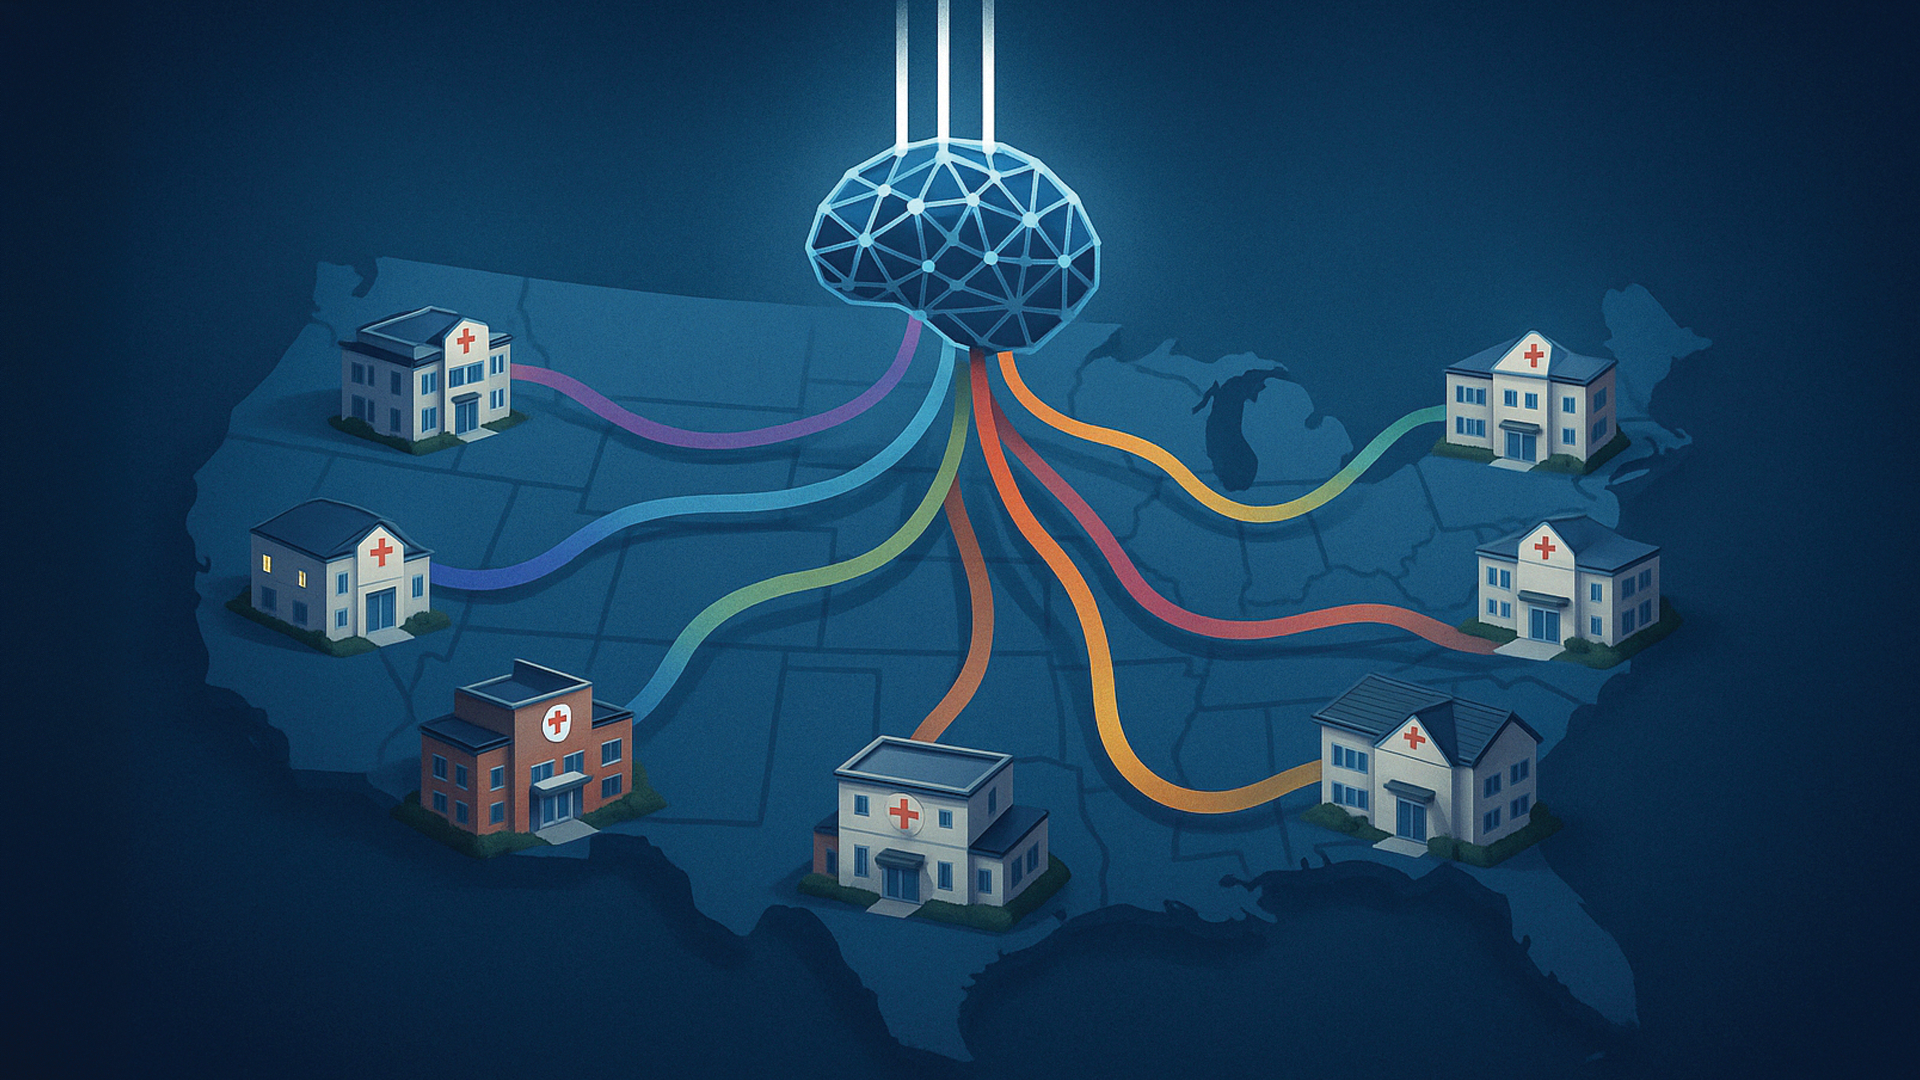
This historical case describes a common data layer for information arriving from different EHR, EMR, and practice-management systems—giving eligibility, billing, and reporting workflows a shared structure instead of a separate interpretation for every source.
Business consequence
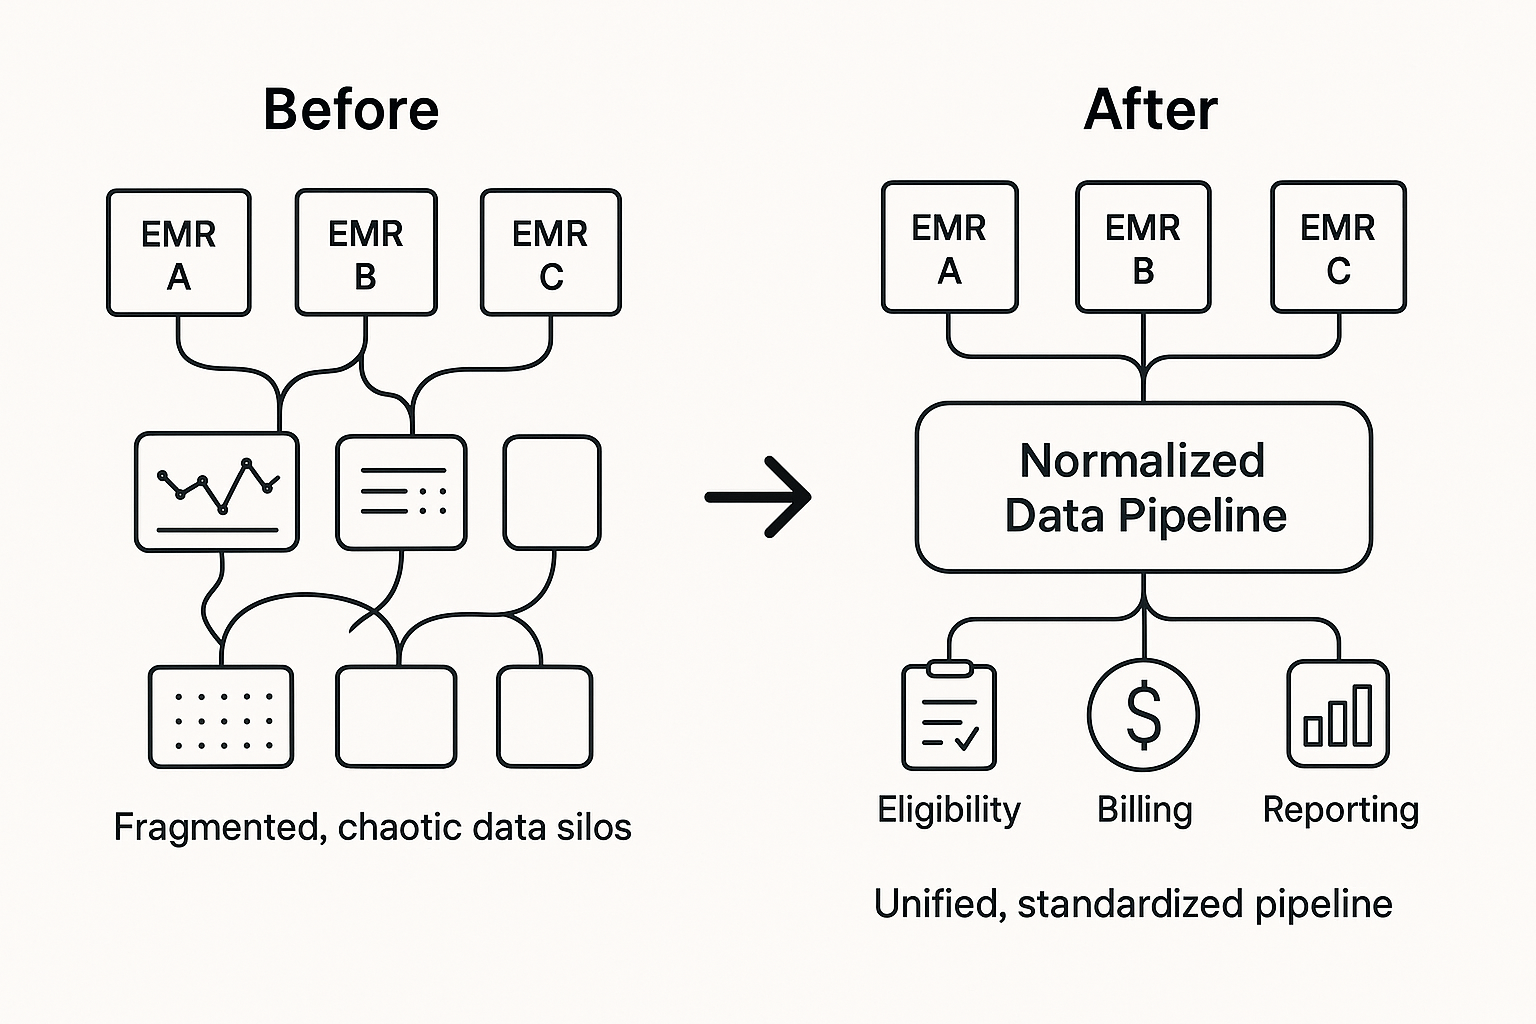
Eligibility, chronic conditions, copays, deductibles, billing inputs, and reports depend on data that may appear as structured fields in one system, freeform notes in another, or a document exported from a third.
The original case describes the resulting burden: specialists learn each interface and downstream logic must account for inconsistent shapes. The aim was to reduce that repeated integration work without treating every system as identical.
Source-attributed scale
The source does not provide a dated integration list, customer identities, implementation or migration timing, patient or record volume, current production status, conformance testing, mapping accuracy, completeness, or independent validation. “Nearly three dozen” is presented as the original case’s self-reported historical scale—not a current universal interoperability claim.
Operating explanation
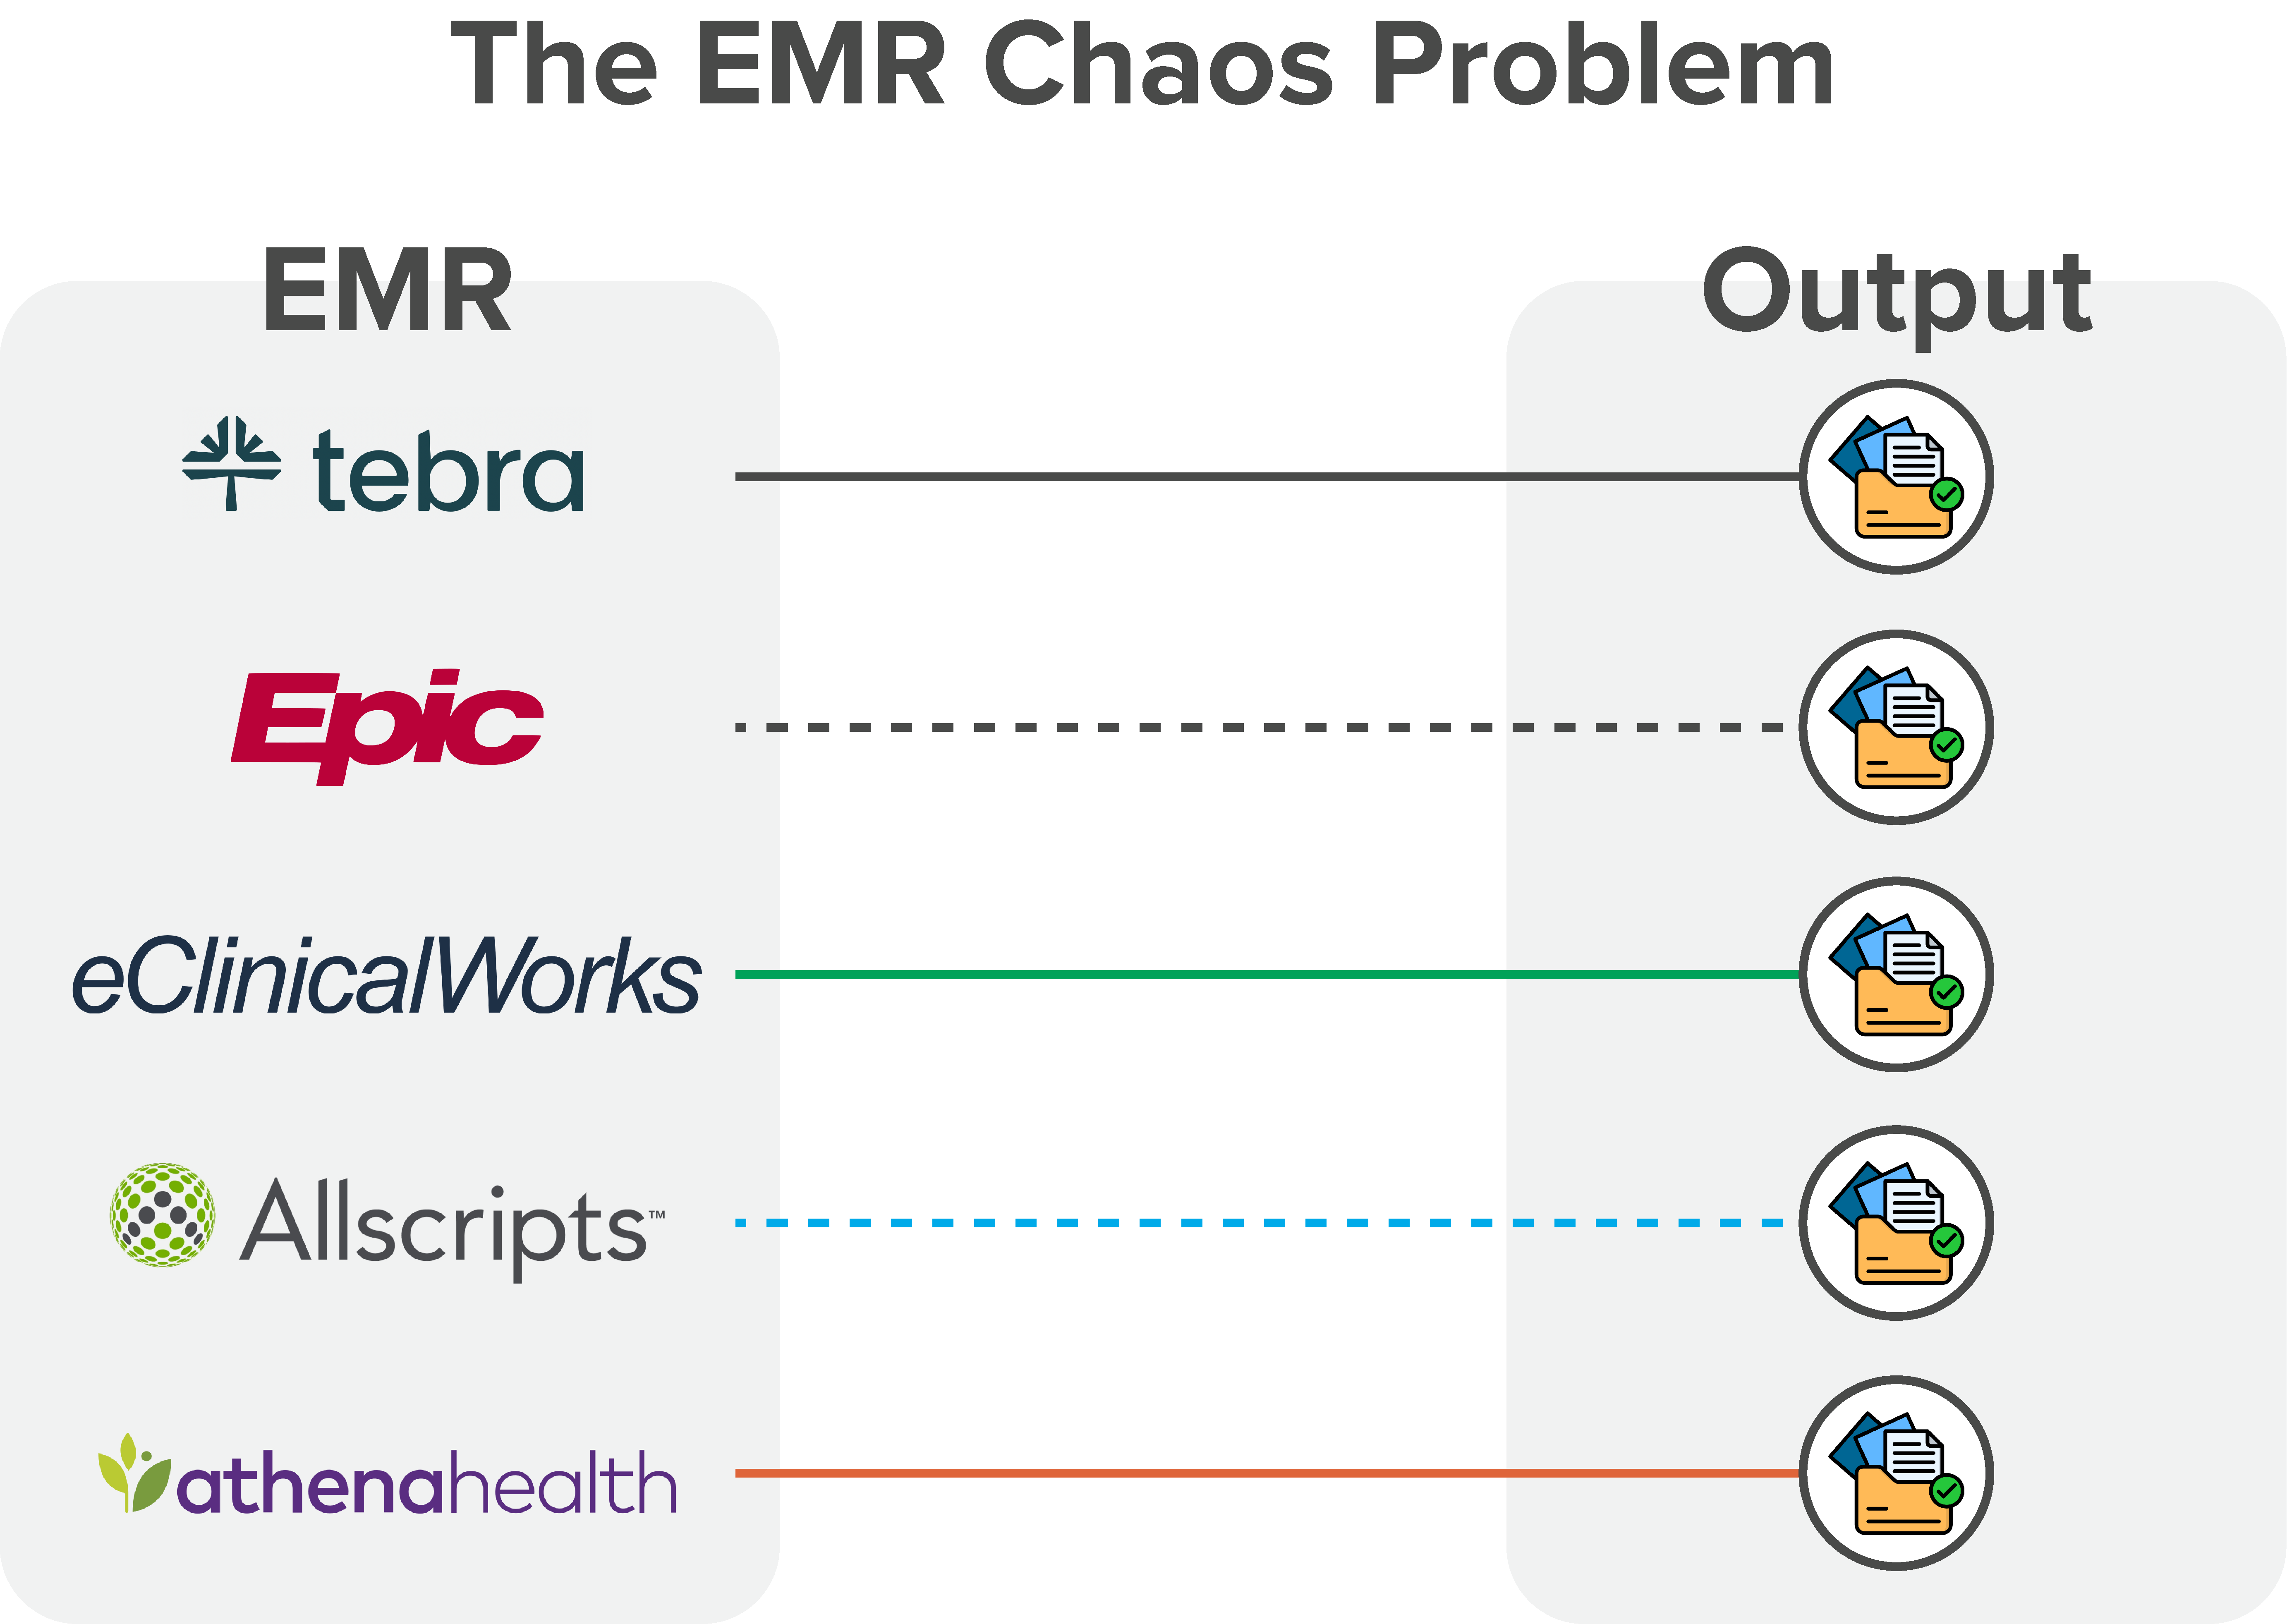
The original narrative also names Kareo and Practice Fusion, alongside Epic, eClinicalWorks, and Athena, as examples of systems teams might need to understand. Those names are historical source examples, not endorsements, partnerships, or a current integration directory.
A chronic condition might appear in a SOAP note, a structured field, or not be represented consistently at all. The integration problem begins with recognizing those differences rather than assuming one schema.
A shared operating model
Receive source data through an API, database access, CSV or Excel file, PDF, ERA/EOB, note, or scan.
Relate source fields and concepts to an internal ontology informed by healthcare terminology and the needs of the operating workflow.
The original process used human review to validate an initial mapping and suggest refinements rather than treating automated output as complete.
Apply the normalized structure to eligibility, billing logic, and reporting without rewriting every downstream rule around each original format.
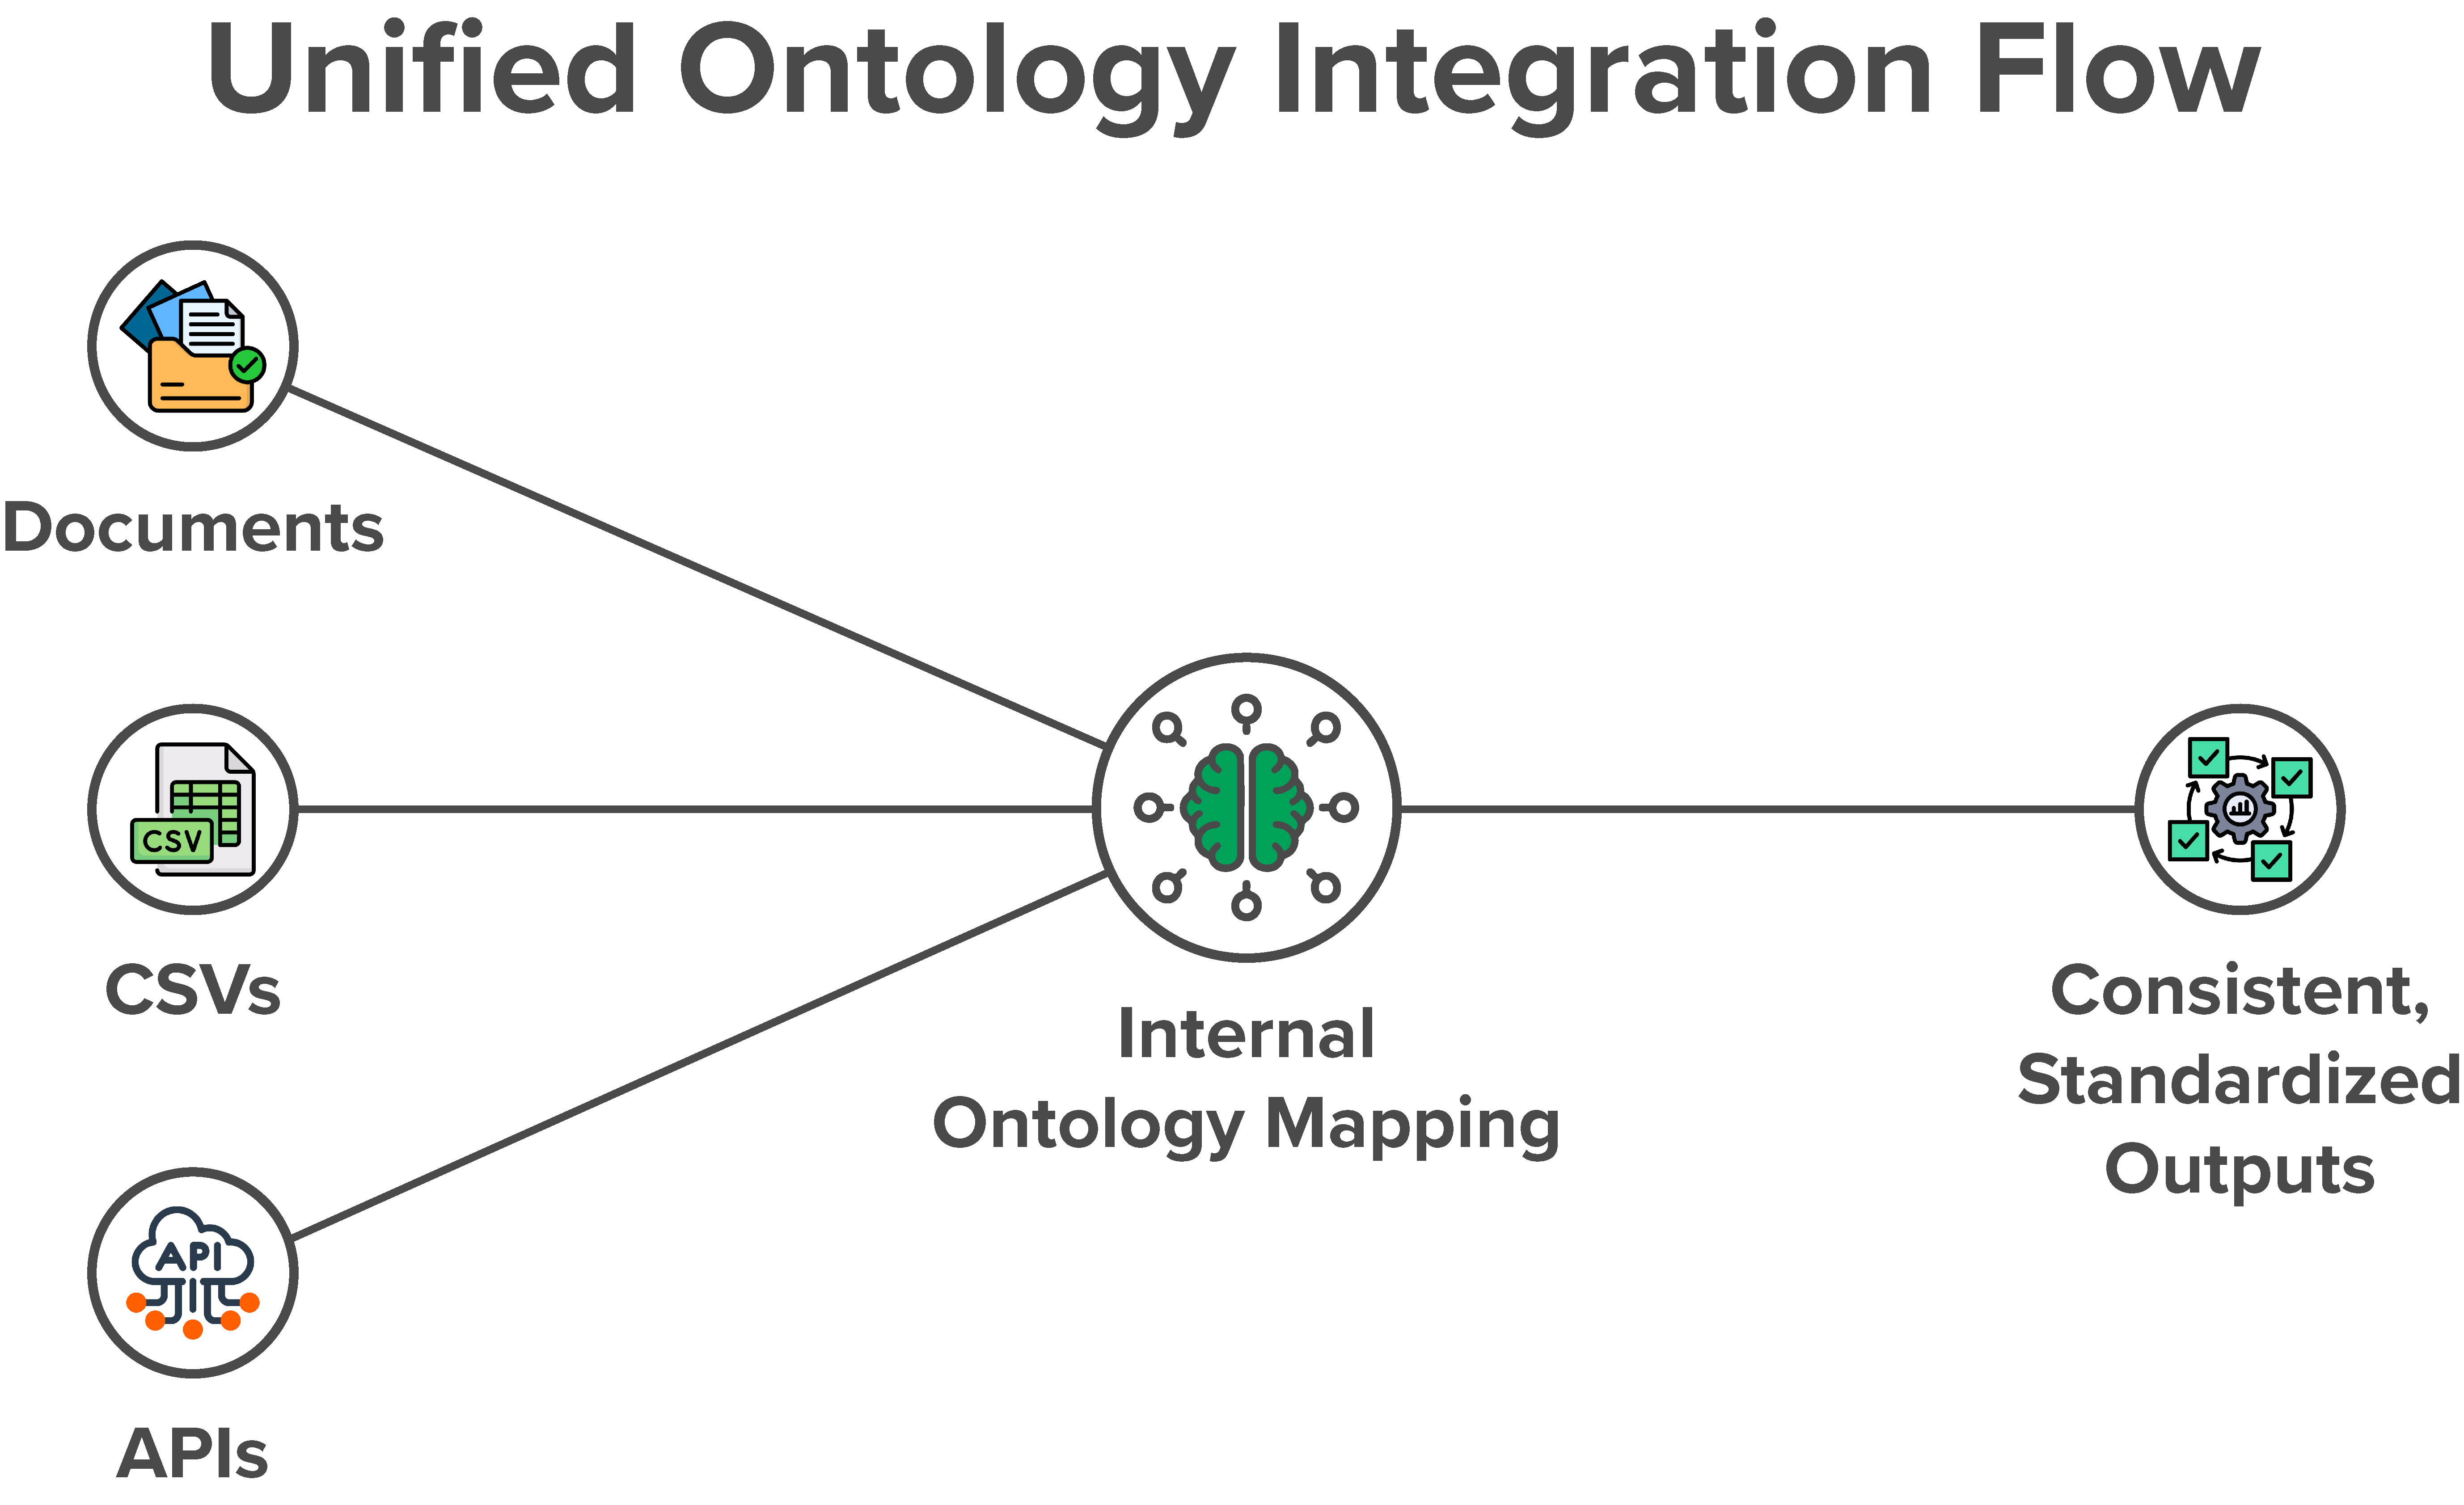
The source describes stitching data from multiple places: demographics from one file, insurance from another, and chronic conditions from a third. That is a mapping and review problem before it is an automation problem.
Healthcare standards and terminology named in the case include HL7, FHIR, SNOMED, LOINC, RxNorm, and ICD-10. Their mention provides semantic context; it does not establish standards conformance or certification.
Technical reason to believe
The original architecture used a shared ontology to represent entities and relationships, with source mappings handling the differences in incoming data. Buffaly powered the ontology layer, while SemDB was described for unstructured or text-heavy inputs.
The original also describes AI-assisted initial mapping followed by human review. That architecture does not independently establish automation rate, mapping accuracy or completeness, implementation speed, deterministic behavior, auditability, security, HIPAA compliance, or current production availability.

Talk to Us
Start with the operating question, the systems holding the data, and the review conditions required before normalized information can be used.
Talk to Us